
How Much Headway Is There, Really?
Ballparking model improvement prospects

We got the data.
We have a baseline model.
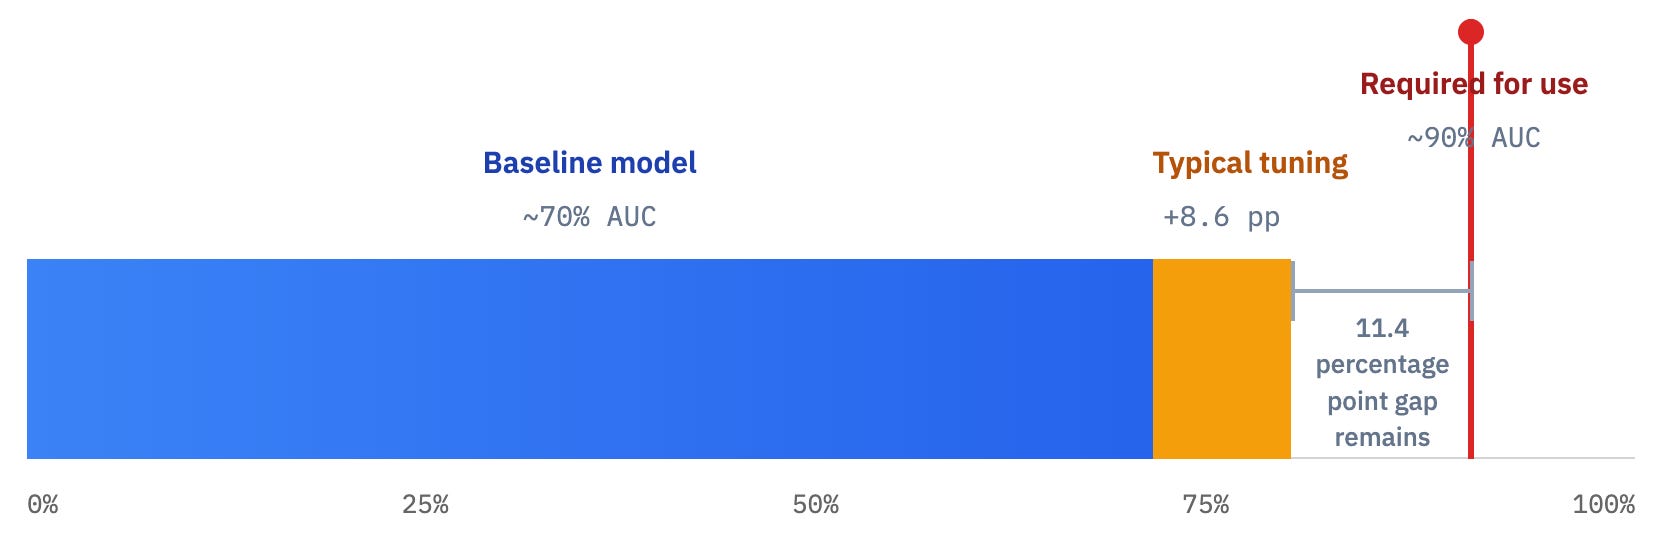
The AUC metric is 70%.
Someone says it needs to be 90%.
The business wants a step-change.
What’s the next move?
Once practitioners have a baseline model, improvement typically comes from three places… what I'll call endogenous improvements1:
1. [Endogenous2] feature engineering
Most model improvement starts with feature engineering; reworking the information already in your dataset so the model can see structure it would otherwise miss.
Examples:
Extracting day-of-week or seasonality from a date column
Creating lags, rolling averages, or ratios
Encoding interactions or nonlinear relationships
Dimensionality reduction (PCA) or clustering-based features
No new data enters the system.
You’re not expanding what the model knows. You’re making existing information more legible.
2. Model architecture
Switching algorithms or combining multiple models (ensembling) to extract different patterns from the same data.
3. Hyperparameter tuning
This is about how aggressively the algorithm searches for structure: tree depth, number of trees, minimum samples per split, regularization constraints.
Different configurations are more successful than others in finding patterns.
A reality check from Kaggle
How much lift — aka headway — can we expect to get from endogenous improvements?
To ground my expectations, I went to Kaggle. It’s the closest thing data science has to a public laboratory.
Kaggle competitions provide:
a fixed dataset
a fixed outcome variable
a public leaderboard
Many competitors begin with a boosted-tree baseline, minimal feature engineering, and default parameters. From there, people iterate with endogenous improvements.
The natural question is:
How much headway is realistically available from that baseline?
The experiment
I analyzed six Kaggle competitions.
For each one:
I trained a basic CatBoost model using the raw competition features
I recorded that baseline cross validation score
I took the top leaderboard score3
I assumed, imperfectly but directionally, that the difference comes from endogenous improvements
I analyzed the distribution of those gaps
The result
Across six competitions, the gap between a simple baseline and the leaderboard winner was consistently modest in absolute terms.
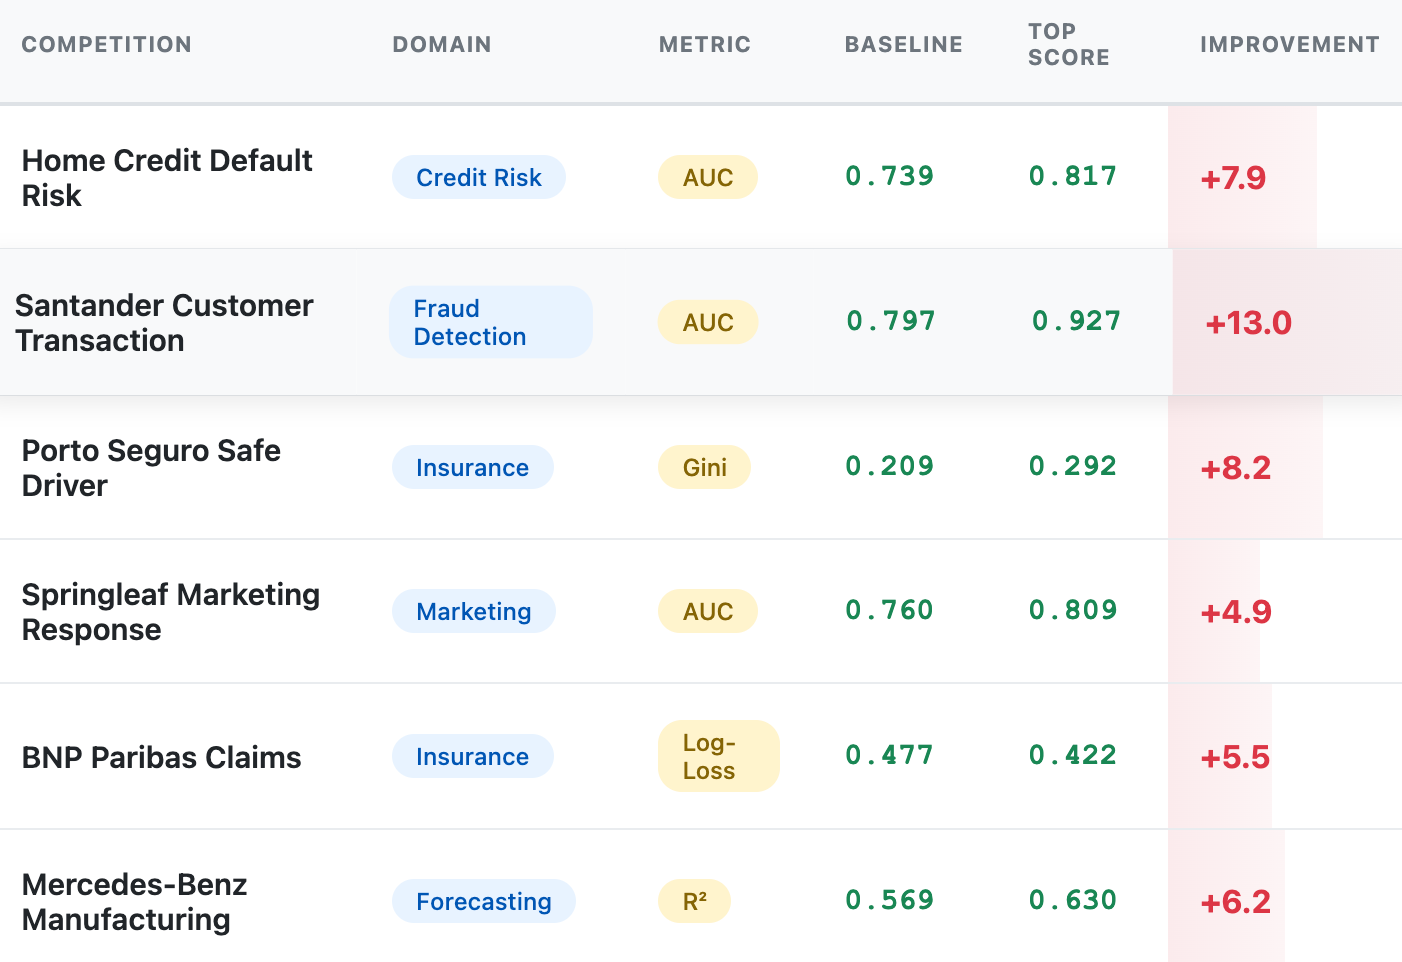
While the metrics are not directly comparable, the pattern is consistent: once the dataset boundary is fixed, improvements from modeling alone are bounded and incremental, not step-changes.
The takeaway
Let’s be honest. An entire SSRN-worthy paper can be done using this methodology.
But it’s a hint: if your starter model is already at ~70% AUC, it is unrealistic to expect that feature tweaks, tree depth tuning, clever encodings will get you to 90%.
That improvement does not come from polishing the algorithm.
If you need that AUC at 90%, you have only one option; change the information boundary or the target itself. Think new sensors, new sources, new raw features, new measurements of the system.
If you want a step-change, you don’t tune harder.
You go upstream.
Transforms/architectures using only fields available at prediction time.
I say endogenous feature engineering to make it distinct from exogenous feature engineering - going out and getting new data.
Leaderboard ≠ pure modeling lift; it also includes validation strategy, leakage avoidance/exploitation, and ensembling. I’m using it as an upper bound on what’s available without new data.