

What might have happened
Data represents only one of many possible realities

In 2015, the Seahawks played the Patriots in Super Bowl 29.
1 You remember the play. […] Seattle is down by 4 points with 26 seconds, second down, goal to go, with one time out.
Everyone in the world, including your grandmother, knew the play coming next. Beast Mode Marshawn Lynch up the middle. No brainer. The man can pick up two yards while ripping open a bag of Skittles without spilling one or fumbling the football.
Just give the man the damn ball, screams Captain Obvious.
Head Coach Peter Carroll calls for a pass. Not a handoff.
Sports critics around the globe herald that one play call as the most asinine in all of Super Bowl history, perhaps including every game ever played in the NFL. But just think if the game ended with a touchdown pass and Seattle victory.
🤔
Is that the only history that could have occurred? No.
Just like every future has uncertainty, so does every past. We see one thing that occurred but we know that an infinite number of other things could have happened. Annie Duke frequently uses the Peter Carroll “good decision / bad outcome” example above to illustrate that decisions and outcomes are distinct. The interception (and the data that was recorded in history with the Patriots winning the Super Bowl) was only one possibly history. It could have easily gone another way… and the historical data would be different.
We apply this concept more broadly. From CEOs making strategic decisions to sports coaches reviewing game footage to investors analyzing market trends - we're all obsessed with using historical data to predict what happens next. This requires data. This requires good data.
Someone in almost every meeting inevitably raises their hand and says 'but the data is bad.' And sure, sometimes the data is bad. But here's the mind-bender:
even when the data is good... it still might be bad.
Why? Because what we're looking at is just one version of countless possible pasts that could have occurred. We're working with what did happen, not what could have happened.
I always get hung up with supply chain data, especially when we build predictive models. We want to use historical data that was created under past constraints (i.e. supplier issues, late deliveries, temporary bottlenecks). A red flag gets raised in my mind - strategy & operations teams’ are always actively working to remove those old constraints, making tomorrow different than yesterday.2 Take empty store shelves, for example. Say we have six months of data showing low inventory because of a one-time supply chain disruption. That's just one possible reality we happened to capture. We're looking at data from a system that doesn't exist anymore, trying to predict a future in a system that works differently. Some people call this data drift. I call it the way the world is.
Good data could still be bad data.
If an analyst can ‘correct’ the historical data, that’s gold. If they can’t, can they introduce some amount of noise to historical data that would make the actual signal more clear?3
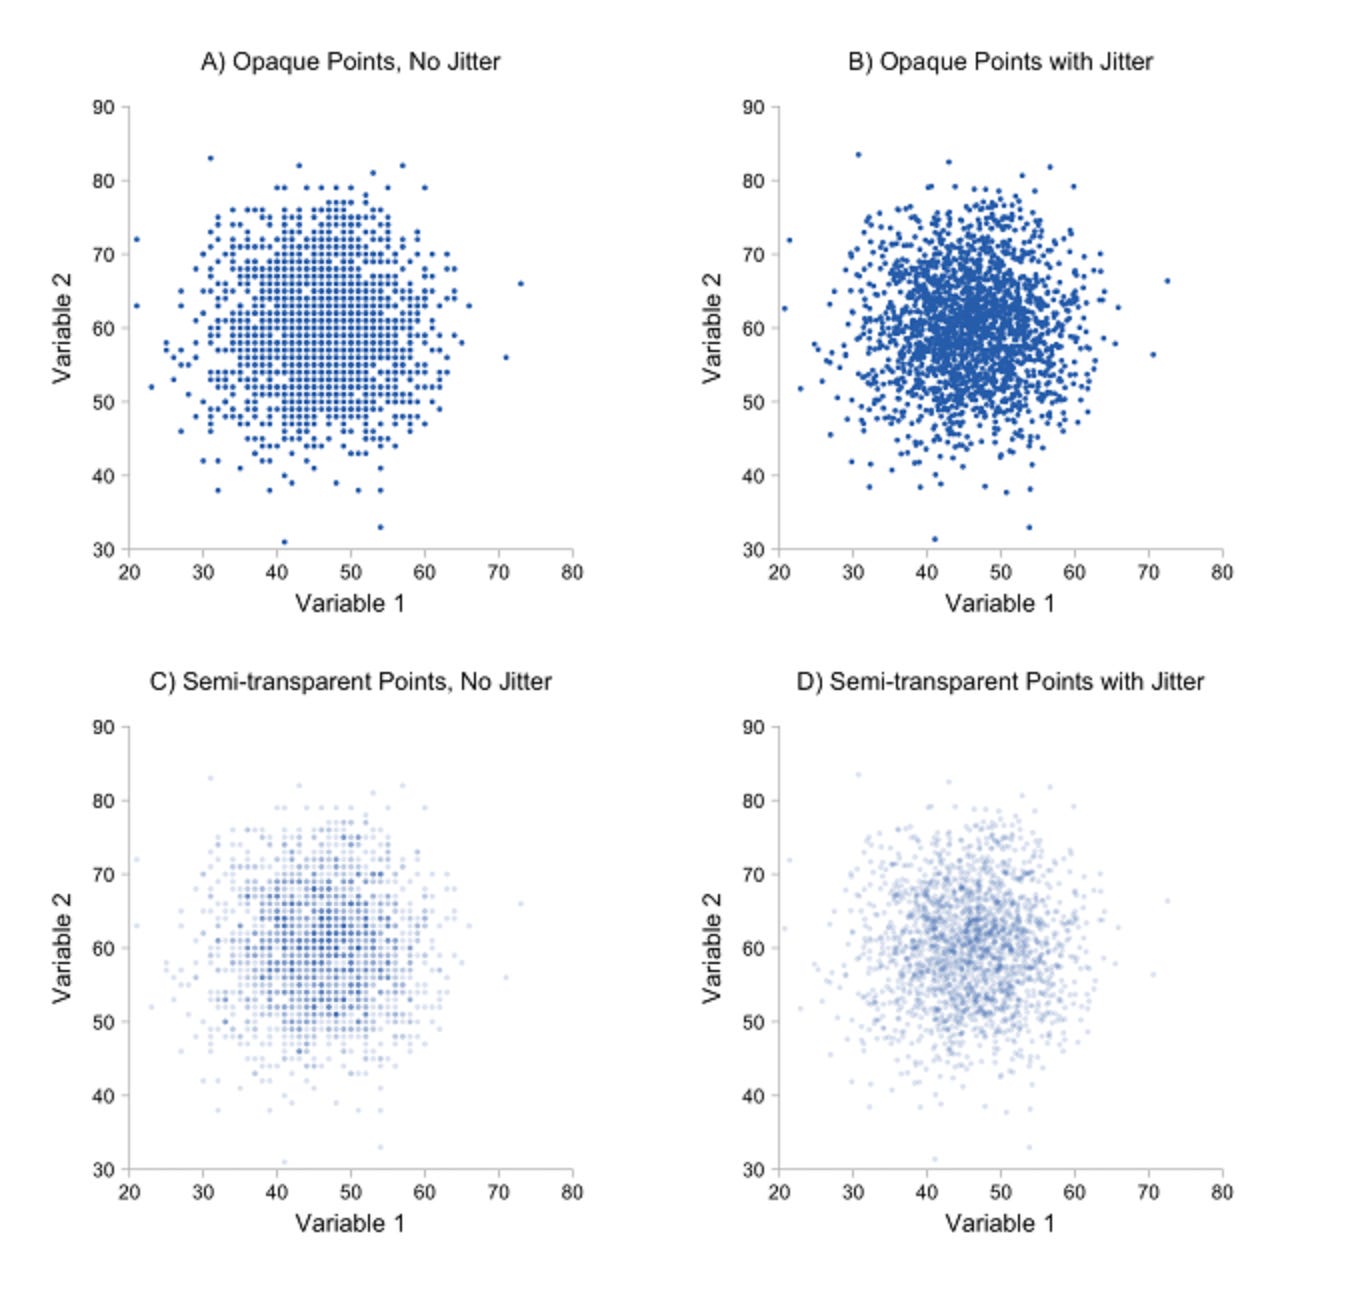
In data visualization, this technique is called jittering. It’s particularly useful in scatterplots. Jittering adds a slight amount of random variation to each data point, allowing overlapping data points to become unique. Combine this making the color or the points slightly transparent, and you reveal patterns in the data not seen before. This is a good example from Infragistics.
What if we did the same with historical data? By adding noise, we're essentially admitting that what happened in the past isn't as fixed or certain as we pretend it is. We're making our data less accurate on purpose, but maybe - just maybe - we're making our models better prepared for the uncertainty of tomorrow.
A really basic example => Boston house prices. If you jitter the training data, you can get better test set performance.
Instead of pasting in a python script, here’s the LLM prompt I would use to get an example script to test the idea:
I want a Python script demonstrating a simple approach for “shaking up” historical training data. Specifically, show me how to:

- Load the Boston Housing dataset (or a similar publicly available dataset).

- Split the data into training and test sets.

- Add a small amount of random noise (jitter) to the training set features.

- Train one linear regression model on the unmodified data and another on the jittered data.

- Compare the MSE (Mean Squared Error) of each model on the same test set.

- For the jitter, just use a normal distribution with a small standard deviation, something like 0.01. Then show me how the MSE differs between the original and jittered data. If the jittered version yields a lower MSE, let me know in the script output. If it’s worse, let me know that, too.

Nothing too fancy, just enough that I can make a point about how “bad data” might become surprisingly helpful when we own the uncertainty and inject it. And please include some print statements that display the MSEs. That’s it.
When I run the resulting script, I get this:
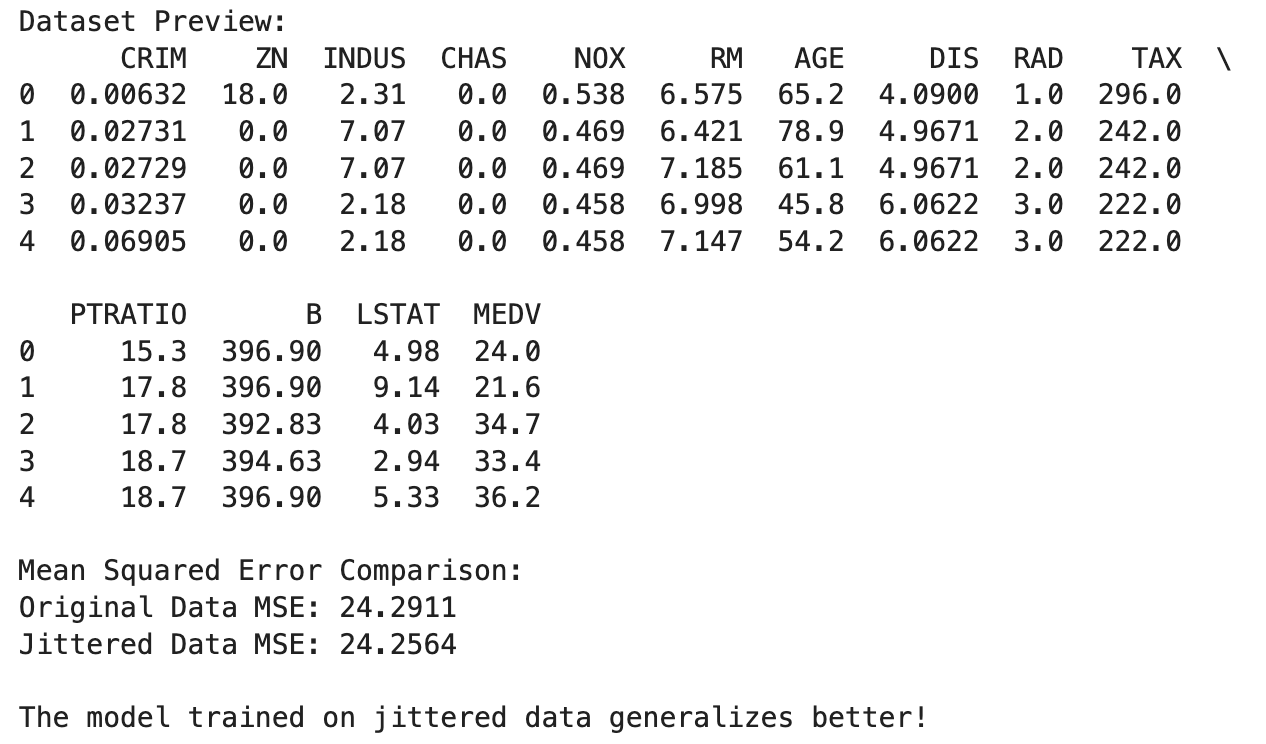
The model trained on jittered data generalizes better!
Huh. The prediction model looking forward works better when we use the noise-added data than the actual data. Huh. This is only an anecdotal example… but it shows me that the idea isn’t totally insane.4
The hopeful takeaway: perfect, accurate data might not be as important as you think because our mental model of "perfect" and "accurate" is flawed. What we really need is data that reflects the world as it is, not as we wish it to be. By shaking up our assumptions and injecting a little noise, we create models that aren’t just good at replicating the past but antifragile… able to learn, adapt, and even thrive in the chaos of the future.
End
Post Script
After I wrote the introduction of this article, I asked chatGPT…
Who else has written and/or talked about this concept? The list made me laugh.
It’s funny, to me, because it’s a roll call of people that I’ve read and listened to for years:
Nassim Tabel: Embrace uncertainty by acknowledging that historical data cannot capture the impact of rare, unseen events or the true variability of systems (The Black Swan).
Peter Thiel: The constraints of the past do not dictate the future; innovation thrives when we break free from historical assumptions (Zero to One).
David Spiegelhalter (he’s talked about a lot on Learning Bayesian Statistics): Statistics should highlight uncertainty, and embracing imperfection can lead to more robust predictions (The Art of Statistics).
Andrew Gelman: Models should balance simplicity and robustness, acknowledging variability and uncertainty to avoid overfitting to specific datasets (Regression and Other Stories).
A good reminder that we think what we consume.
Well written, Dennis Brady. https://dennisbrady-32730.medium.com/bad-results-bad-decisions-adf06e0f322a
Of course, this is why when building predictive models we want an insane amount of input data. Just like in traditional statistics, the more observations you have, the more likely the results are to be reliable.
For ML folks, this is similar… but different… to using regularization.
Again, if you are an ML or statistics bro… you are probably telling me that this is the same as using regularization. Yes, they both have the same end goal of improving generalization. But, regularization doesn’t work as a good explanation for business decision-makers. This version I present, I think, has a higher probability of helping business decision-makers embrace the idea.