

When Algorithms Find Things That Aren't There
What synthetic data taught me about finding undervalued stocks

I thought clustering would easily identify underperforming stocks. It didn't.
The Setup
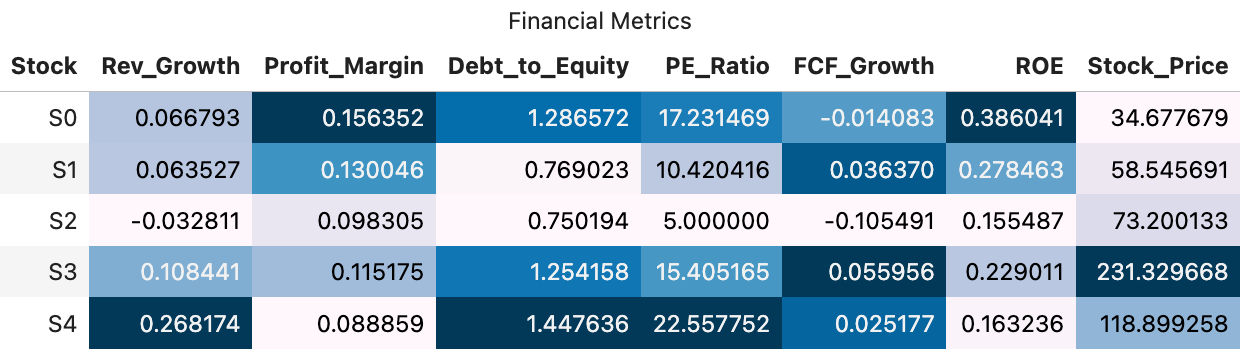
I created synthetic financial data - stock prices with metrics like revenue growth, debt-to-equity ratios, and P/E multiples.
Why? To practice clustering algorithms that could identify underperforming stocks. Make some money, of course.
This works in retail operations. We start by grouping stores by size, but that's just the beginning. When we discover more complex clusters based on multiple factors, we get truly homogenous groups that should perform similarly. All Stores have ~95% in-time pick performance. Within a cluster, Store #42 has a 95% on-time pick rate (looks “normal”) while its true peers achieve 99%. These aren't just similar stores - they're almost identical in their operating conditions. That's when you know exactly where to focus.
Seemed like this should work for stocks too.
No Groups, 2 Clusters
My first generative dataset had no explicit groups. I just made sure it reflected realistic financial relationships - higher revenue growth correlates with higher profit margins, that sort of thing.
I ran k-means clustering. The elbow method suggested 2 clusters1.

Wait, what? I didn't create any groups intentionally, but the algorithm found them anyway.
Did I miss something obvious? Or did the algorithm see patterns that weren't really there?
Both, actually. The covariance structure I used to create realistic financial relationships created unintentional patterns that resembled:
Growth stocks: High revenue growth, high debt, high P/E
Value stocks: High profit margins, low debt, high ROE
4 Groups, 3 Clusters
Then I created data with four explicit groups:
High-Growth: very high growth, very low margins, moderate debt
Stable-Profit: low growth, very high margins, very low debt
High-Debt: no growth, very low margins, very high debt
Cash-Cow: moderate growth, extremely high margins, almost no debt
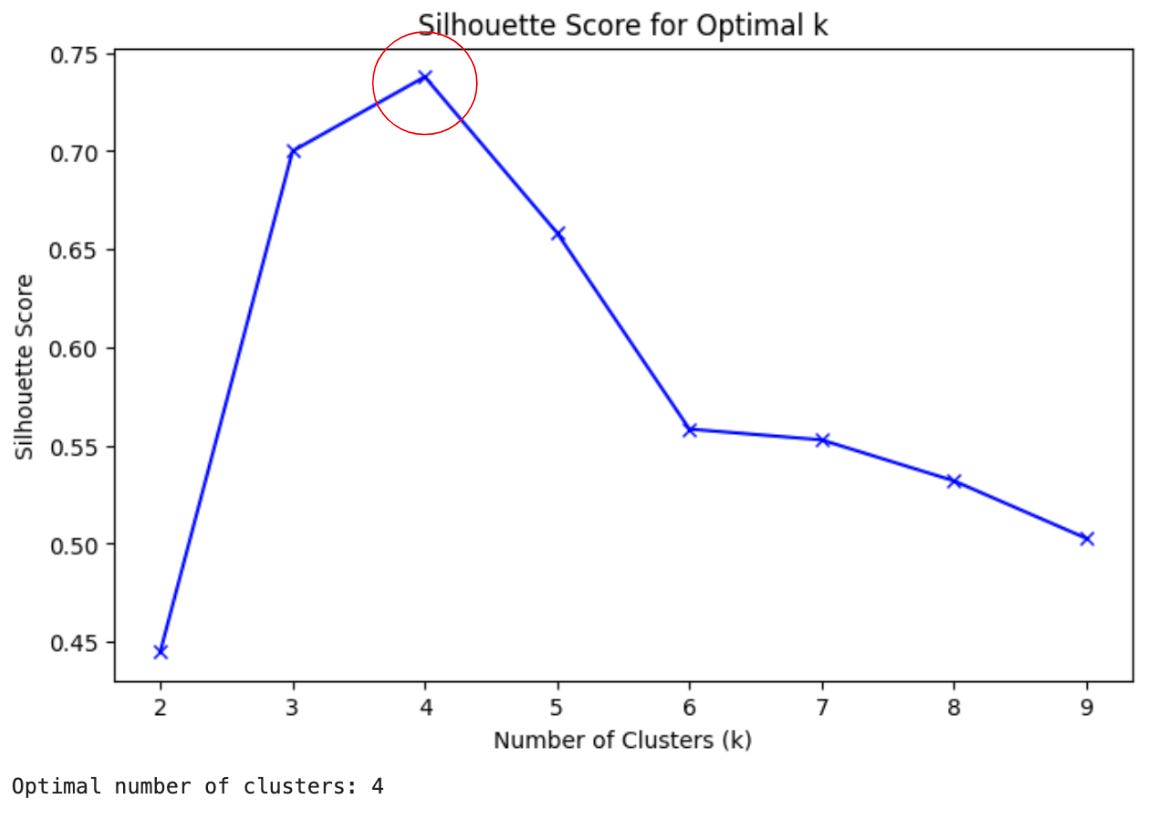
I applied PCA, then clustering using the silhouette method.

I still used k-means, but I switched from elbow to silhouette method (a “more robust” approach) to identity the best number of clusters.
The algorithm found 3 clusters. But I made 4 groups in the generative data!
Exaggerating the Differences
What if I pushed the groups further apart? Then the algorithm found my four groups.
But in the real world, I can't change the data. I need something more reliable.
4 Groups, 8 Clusters!
Maybe not k-means.
Maybe Gaussian Mixture Model instead?
It suggested 8 clusters. Oh boy.

There Is No Right Number
I realized something important: there is no "correct" number of clusters. The algorithm doesn't discover something that's objectively there - it organizes data according to patterns I ask it to find.
What matters is whether the clusters are useful for my purpose: identifying underperforming stocks.
This Might Work After All
I compared underperforming stocks identified by each method:
K-Means with k=2 on the single-distribution data
K-Means with k=3 on the 4-group data
GMM with k=8 on the same 4-group data
Two stocks consistently appeared as underperformers across all methods: S424 and S242.
Interestingly, S424 was underperforming globally, but S242 only underperformed within its peer group - something I wouldn't have noticed without clustering.
What I Learned
Clustering doesn't find the "true" number of groups. It finds useful ways to organize data.
The value isn't in perfect clusters, but in the insights they provide.
Different approaches can reveal different insights. Use multiple methods.
Sometimes the most valuable insights come from comparing results across methods.
For real-world stock data, I'll need to:
Preprocess carefully
Apply multiple clustering methods
Validate clusters against external metrics
Cross-reference underperforming stocks across methods
Compare to a non-clustered analysis
Test with real trades
The goal isn't perfect clusters. It's profitable insights.
And sometimes the best insights come from seeing when different methods agree - even when they're all slightly wrong.
Bonus: you can copy and paste this whole article into Grok-3 and ask for python code to replicate this whole analysis!
I know, I know… elbow method is no longer loved => https://arxiv.org/pdf/2212.12189